
#CarbonCatchers series
As discussed in last weeks article on the carbon emissions per capita worldwide, it is clear that there is a major disparity in emissions between developed and developing countries. While the world average for emissions is 6.27 tonnes #CO2eq per capita per year, in many African and South American countries the average emissions can be a tenth of this figure. On the flip side, many countries in Europe have emissions which are double the world average. As Tree-Nation previously based its calculations for offsetting on the European average, this article will be dedicated to updating this calculation.
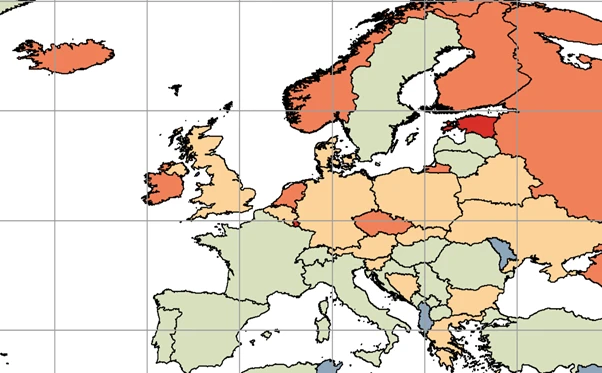

Figure 1: Graph of CO2eq emissions per capita across Europe. Extract taken from Janssens-Maenhout et al., 2017.
Previously in 2011, Eurostat estimated that greenhouse gas emission per capita in the EU were roughly 9 tonnes of CO2eq per year (Moll and Redmond-Tiedrez, 2011). This calculation was done by using a modelling estimation on input-output data collected from member states and aggregated. The largest proportion of the 9 tonnes per capita is as a result of consumption activities by both households and governments, a further 1.9 tonnes per capita is used in private households burning fossil fuels and the final 1.6 tonnes per capita is due to EU investments. While this calculation is an excellent base line figure to work off, all of the data is from 2006 and so is out of date due to changes in emissions and the addition of another country to the EU.
The most recent publication by Eurostat indicates that emissions in 2018 fell by 2.5% compared with 2017 and have on average been falling since 2006. For the majority of member states, emissions in 2018 were reduced with the largest reductions being in Portugal (-9%), Bulgaria (-8.1%), Ireland (-6.8%) and Germany (-5.4%). There were some member states however which saw an increase in emissions, with Latvia (+8.5%) and Malta (+6.7%) showing significant increases in #CO2eq emissions in 2018 compared with 2017. It is worth noting that the countries which show the largest increases in emissions only make up a very small proportion of overall EU emissions. These figures are all early estimates (Palen and Goll, 2019).
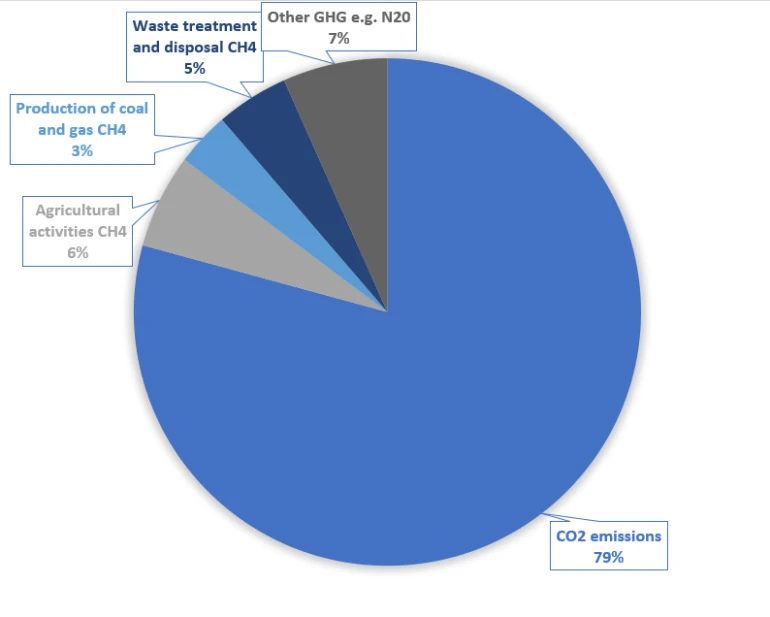
Figure 2: Pie chart showing the percent composition of total EU-28 greenhouse gas emissions by type. Data sourced from Janssens-Maenhout et al., 2017.
The international energy agency, which shows CO2eq emissions per capita based on fuel combustion alone, also shows a decline in emissions released by EU-28 over the past number of years (IEA Data Services, 2020). This can be seen in figure three below. It also shows how the CO2 emissions per capita per year are higher than the world average but significantly lower than the USA. However, a worrying trend is that while both the USA and EU-28 are showing declines in CO2 emissions, the world average for emissions is increasing.
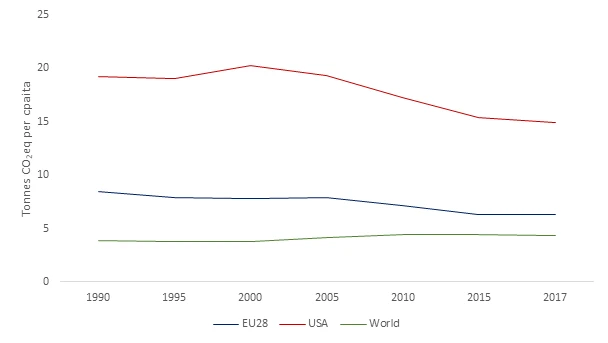
Figure 3: CO2eq emissions per capita per year for the world, USA and EU-28 member states. Data sourced from the International Energy Agency.
A more precise calculation for EU-28
Based on data from Eurostat, emissions have been falling steadily within EU-28 since 2006. If we take 9 tonnes CO2eq per capita per year as the baseline and apply the estimated changes in emissions calculated each year by Eurostat, the new figure we arrive at is 8.5 tonnes CO2eq per capita per year. While this is an improvement, it must be remembered that these figures are all estimates.
For its own CO2 Neutral program Tree-Nation maintains the figure of 9 tonnes CO2eq per capita to keep a safe margin. But also offsets 3 extra tonnes to not only go Neutral but allow its program to have a true positive impact.
Will Brexit affect these figures?
Data from 2018 also shows how the United Kingdom represents 11.4% of total CO2 emissions in the EU with a minimal decrease (-0.3%) from the previous year (Palen and Goll, 2019). Although, when this is converted into per person, the UK is slightly below the EU average at 8.45 tonnes CO2eq per capita per year (World Resources Institute, 2014). However, given the large population of the UK and the large proportion of emissions made up by the UK, it is likely emissions per capita in the EU will change but by how much is as yet unclear.
Our calculations:
The greenhouse gas emissions of one person in the world is, on average, 6.27 tonnes of CO2eq.
The greenhouse gas emissions of one person in Europe is, on average, 8.5 tonnes of CO2eq.
The greenhouse gas emissions of one person in the USA is, on average, 19.9 tonnes of CO2eq.
Keywords: #eu28 #co2neutral #offset #ghg #co2eq #co2emissions #EcoEducation
References:
IEA Data Services, 2020. Data and statistics. Accessed January 2020 <https://www.iea.org/data-and-statistics?country=EU...>.
Janssens-Maenhout, G., Crippa, M., Guizzardi, D., Muntean, M., Schaaf, E., Olivier, J. G. J., Peters, J. A. H. W., Schure, K. M., 2017. Fossil CO2 and GHG emissions of all world countries. EUR 28766 EN, Publications Office of the European Union, Luxembourg.
Moll, S. and Redmond-Tiedrez, I., 2011. CO2 emissions induced by EU’s final use of products are estimated to be 9 tonnes per capita. Eurostat statistics in focus, 22. Accessed January 2020 <https://ec.europa.eu/eurostat/documents/3433488/55...>
Palen, R. and Goll, M., 2019. Early estimates of CO2 emissions from energy use. Eurostat, Accessed January 2020
<https://ec.europa.eu/eurostat/documents/2995521/97...>
World Resources Institute, 2014. Climate Analysis Indicators Tool (CAIT) version 2.0. Washington DC: World Resources Institute. Accessed January 2020. < https://web.archive.org/web/20160528015511/http://cait2.wri.org/historical#>


