A New Tree-Nation #2

A New Tree-Nation #2

12

Hello Everyone! Here is some good news to celebrate the week-end!


Two months ago Max told you that the Tree-Nation team has been working on a new website
and we thank you for your enthusiasm.
We think you deserve to know how we progress on it and we are thus launching this new series of articles called “A New Tree-Nation” in which you will know everything about the future website. Twice a month we will post pictures of the new website.
We would like to have your feedback so we can create the perfect website to plant even more trees, even more easily, and make the planet a better place!

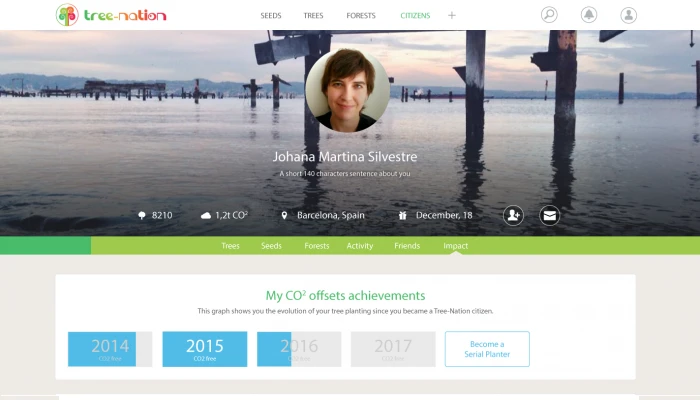
So today let’s see what your profile is going to look like and particularly how your CO2 offset will appear.
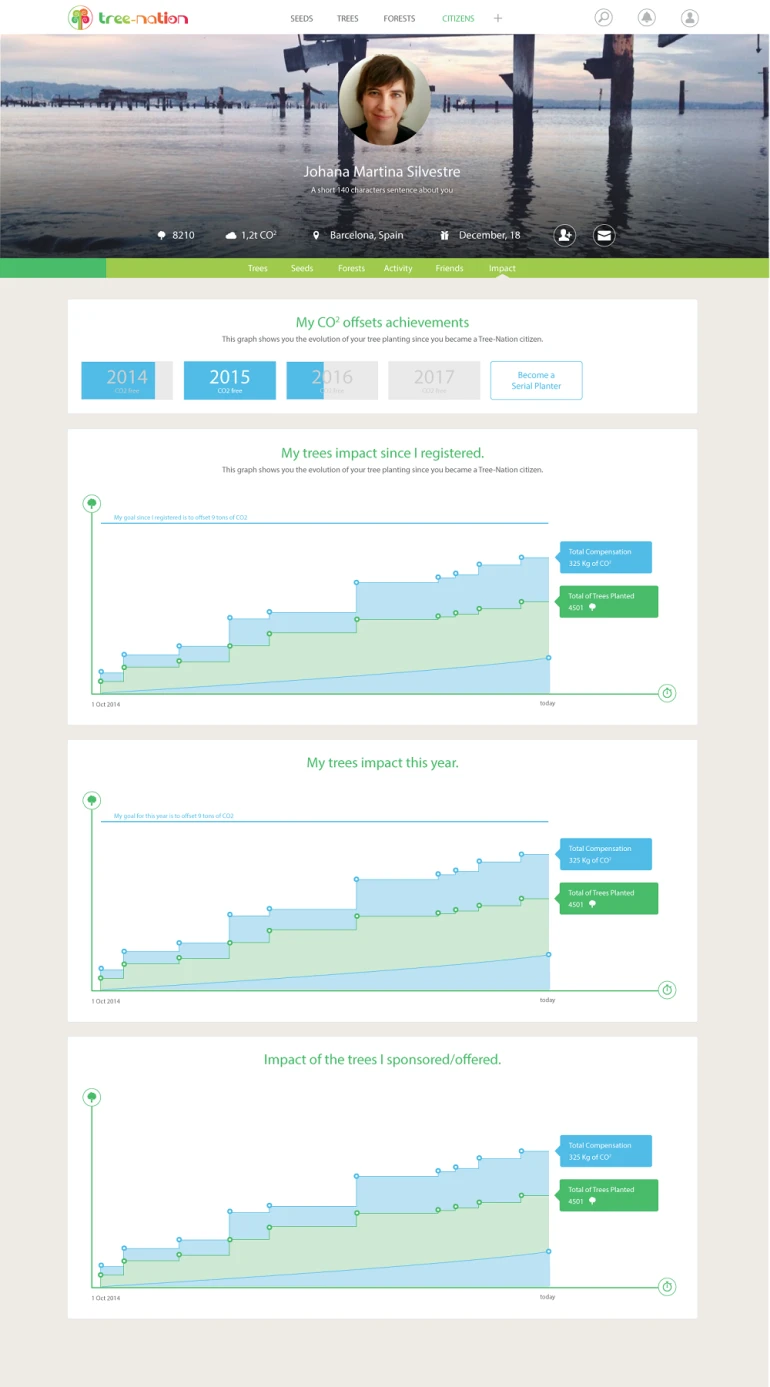
You can click on the picture to access a zoom view.

So, what do you think? Is it easily understandable? Do you like the design of this new section?

Leave a comment
Maxime Renaudin
Company
12 June 2015
This is a complete new section. The graphs include 2 things: your current trees and CO2 offset levels but also a goal to be 100% CO2 neutral!
Trish Geidel12 June 2015
 I LIKE THE GRAPHS IDEA, VERY MUCH !WILL IT BE ON OUR PROFILE PG, OR OUR WALLS, OR SOMEWHERE ELSE ?
Maxime Renaudin
Company
12 June 2015
Thanks Kittehlady
have you seen you can open the file to zoom in?
It will be under "impact" inside your profile. This is a section that doesn't exist yet.
Nick Bailey13 June 2015
I like it. Would a business have some sort of tailored calculation?
Ru Hartwell13 June 2015
Wow! -  Superb. Its great to be able to see your impact made real in this way. With CO2 being invisible it is hard for us to get any true perspective on our emissions or absorption and this often makes offsetting a bit abstract. If CO2 was purple we probably wouldn't be facing the facing the problems we are now. This is a World First - a direct visual representation of my personal contribution to our shared challenge.
<br type="_moz" />
Seed and grow15 June 2015
Hello TN,

that will be a great step forward. Can't wait seeing it. It would be cool, if the data can be actually exported into
&nbsp;a worksheet. That would be very useful for companies, who are at Tree-Nation.

Kind regards
&nbsp; Thomas<br type="_moz" />
Maxime Renaudin
Company
15 June 2015
@Seed and grow. Thanks Thomas, the export data is a good idea

@ruhart Very true. In fact I saw recently a reporting of some scientist team being able to actually "see" CO2 on a video camera. It would help people realize. Personally I started to use an app for my city Barcelona which provides daily data on NO2 and PM2.5 and other nasty gases we have around us. It changes the perspective when you can view or calculate it.

@Yorkie We offer CO2 compensation services to companies too and they'll also have access to such graphs. However it can be tricky for a company to know it's CO2 impact. It can in fact be difficult and expensive to "precisely" calculate it (using non-TN consulting services). I always recommend to go through this interesting process, because that gives you plenty of ideas on how to reduce your impact. But I also recommend not to wait any time before starting offsetting the company CO2 emissions. Not having a precise figure is no excuse to stand still and do nothing.
So what we offer is a solution which is very easy and quick to implement. A good first step in the right direction. So we use averages and one that we find convincing is to offset CO2 per number of employees. Except if you're in a heavy industry, it works well for plenty of service industries. Tell me if it's unclear.
Anke Langhans25 June 2015
Hi Max,

sorry I'm a bit late ;(
I also like to visualize what is not to see. People tend to say there is no problem when they can't see it.

But to be honst I don't really understand the lower row of blue color.
To line of 9 tons, the steps of my planting and the steps of that impact is clear. But I would expect that the green tree section starts on the bottom. I am a bit confused about the green "river" on the blue.

And I would prefer a real diagram with measurements. Means points at each ton CO2 on the left line and each year or month on the lower line. And I am curious how it will look like when you don't show only 1 year but e.g. all years from the start of TN? Can you show this example with "Seed and grow"s trees?&nbsp; @Thomas: I hope you agree ;)

Is the "impact" only for my eyes or can I visit my friends or others "impacts"? Is there a "best of impacts" like it is today with the best of trees planted?

Oh yes, I am curious.
Anke<br type="_moz" />
Marco Pisan27 June 2015
&nbsp;It seems very modern and useful!I hope to see this data on my profile!:-)
Ruth McD1 July 2015
Very cool:)
Maxime Renaudin
Company
2 July 2015
Thanks for the feedbacks!
@Anke&nbsp;
I try to answer all your questions:

"But to be honst I don't really understand the lower row of blue color."

Yes I understand your confusion. This blue section will have a much needed explanation when you click on the little round icon at the end of the line. It will say: This is your current CO2 compensation. And lead to a learn more link.
Let me explain: &nbsp;the Total Compensation &nbsp;register the whole CO2 a tree will compensate during its lifetime. When you plant a tree, this number increase right away.
The Current compensation indicates how much of the Total compensation you have achieved so far.
Is that clearer?


"But I would expect that the green tree section starts on the bottom. I am a bit confused about the green "river" on the blue."

It starts at the bottom. The horizontal axis is TIME. It starts, depending of the graph: when you registered or this year. So you don't necessarily have 1 tree when you register. And it can "jump" from 0 to 10 trees, for example, if you happen to plant 10 trees at once.


"And I would prefer a real diagram with measurements"

You'll be able to click on each round spot and read the measurement there. We could do measurements on the axis, why not, but it might not be on the same scale from 1 user to the next. Our design may evolve anyway if we get a lot of feedback in this direction. Here the main idea was to have a clean design. It would not be easy with measurements because we'll have to put measures for trees and measures for CO2 in the same vertical axis (one on each side I guess!). Not that nice and simple!


"Can you show this example with "Seed and grow"s trees?"

We will have a web version soon. But understand this is with no real database here (just design purpose). If we add the database we'll have the task completed already!


"Is the "impact" only for my eyes or can I visit my friends or others "impacts"

Yes! You'll be able to see everyone's impact. And also the companies impact (in their forest) and any forest impact.
If someone "trash" our planet, we should notice. If someone "cleans" it, why not showing it as well?&nbsp;


"Is there a "best of impacts" like it is today with the best of trees planted?"

Really! Did we forget that!! It could be a nice idea, thanks!
Seed and grow8 July 2015
@max - my suggestion for examples is: ramdomly picked individuals as well as companies, who support TN.
My contribution here is most probably a bit "out of range".&nbsp; I'd love welcoming other members having
&nbsp;many trees. There is quite a group of people who helped planting thousand or more trees.

@all - I think TN should NOT engage in any benchmarking on a member level. This is not a cpmpetition!
&nbsp;In some situations the unimaginable becomes possible. Just go for it.