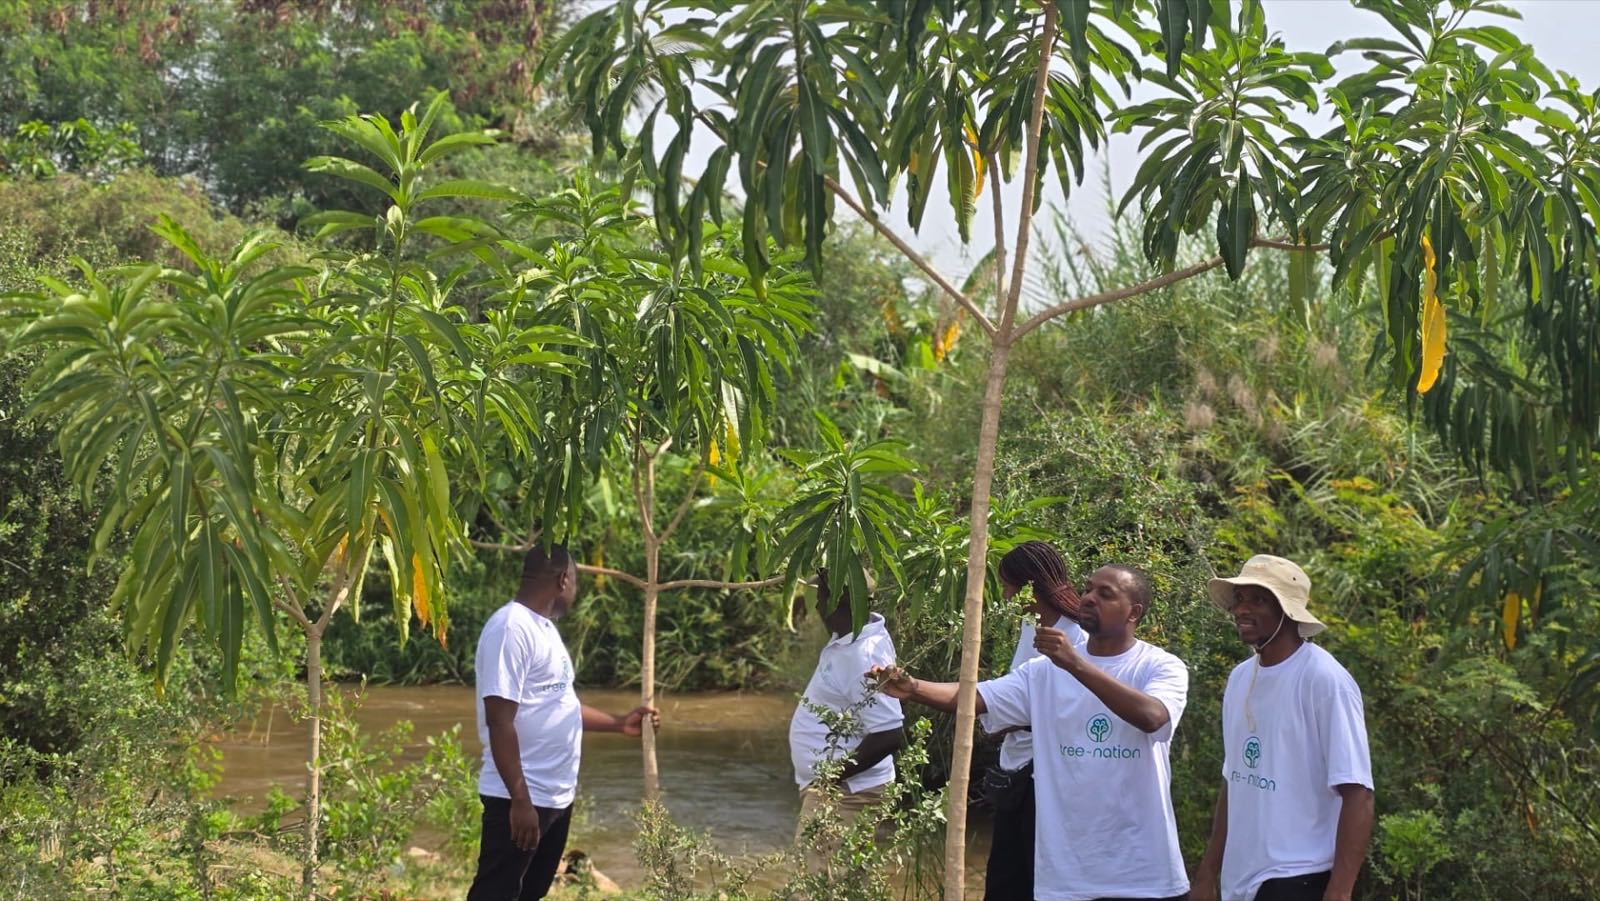
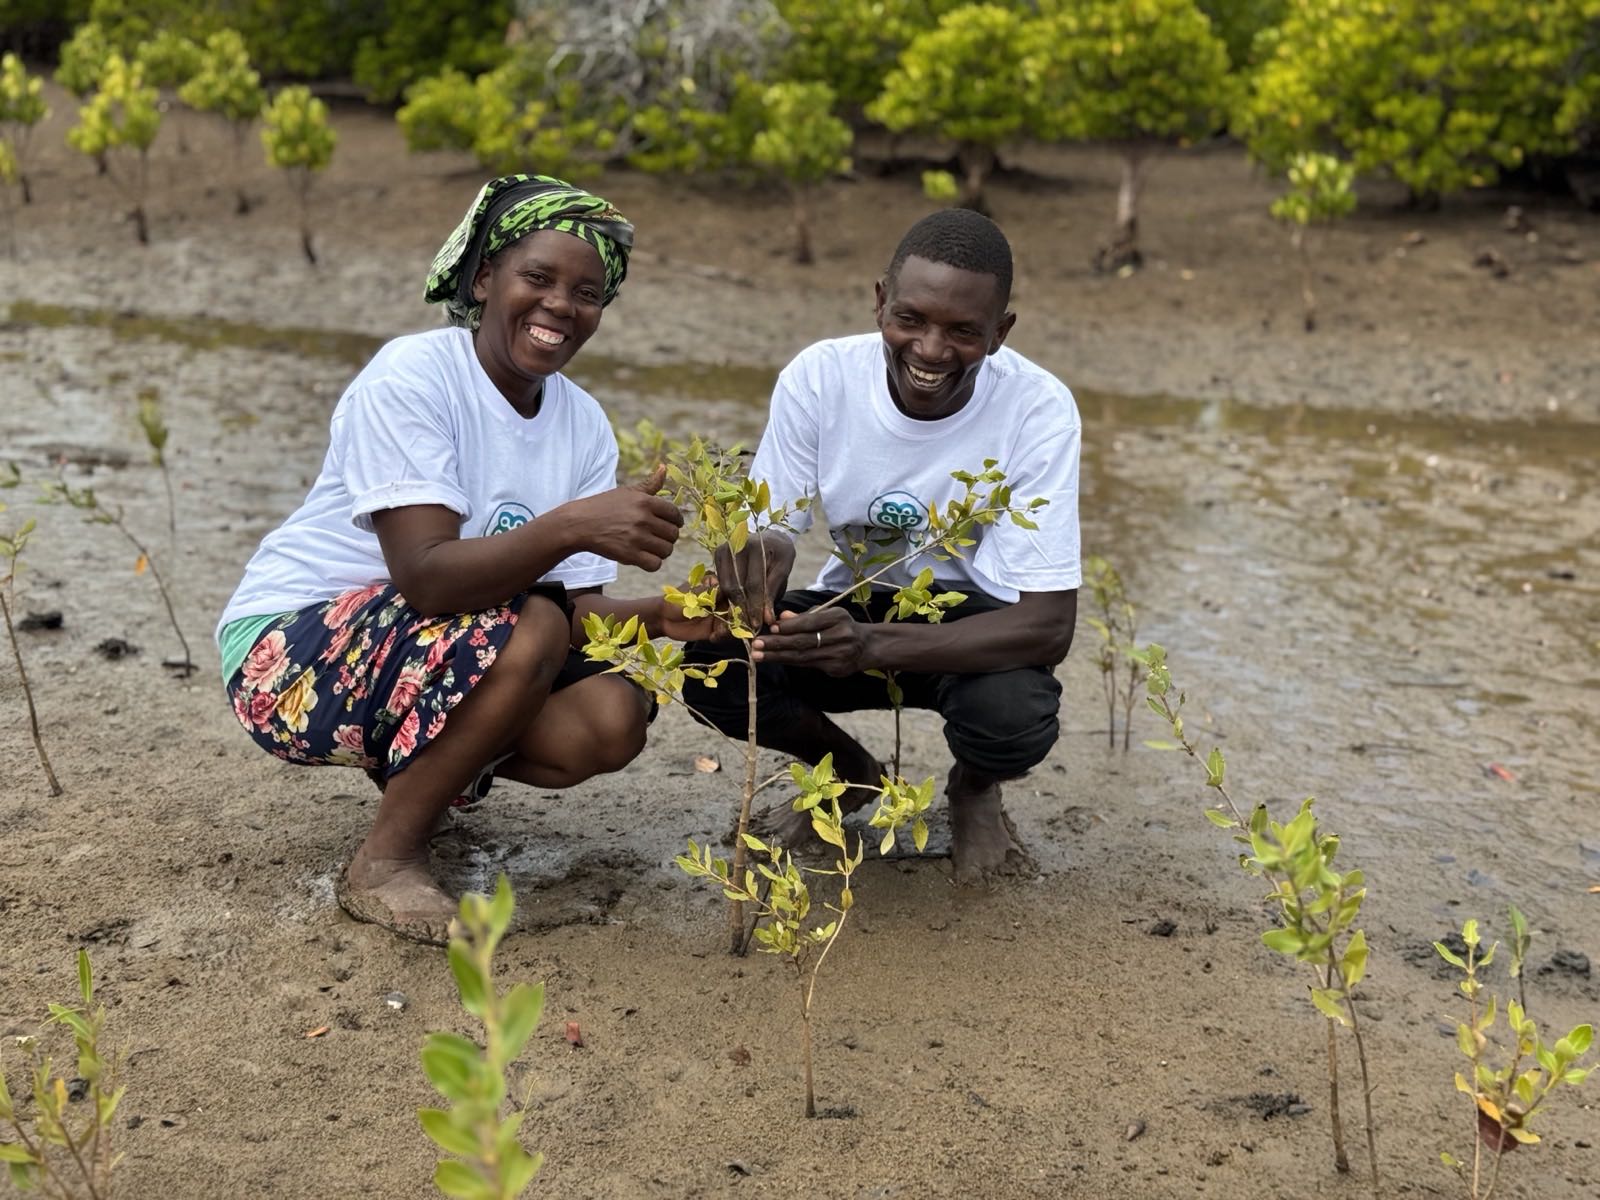
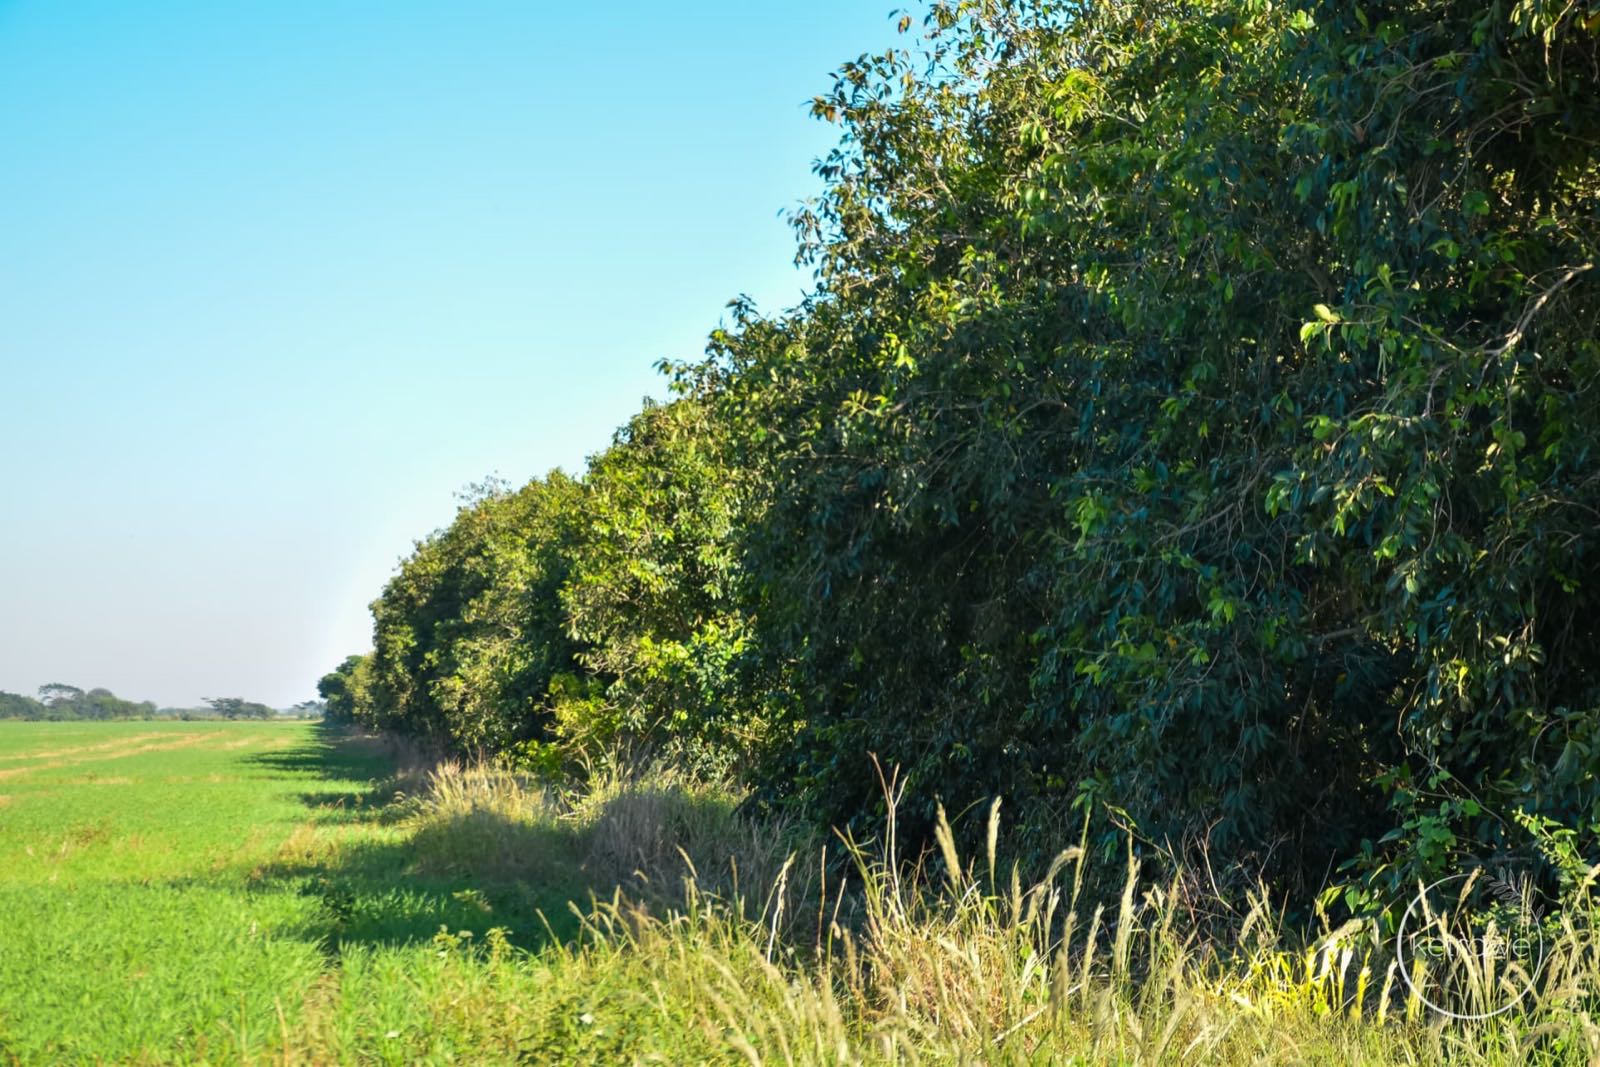
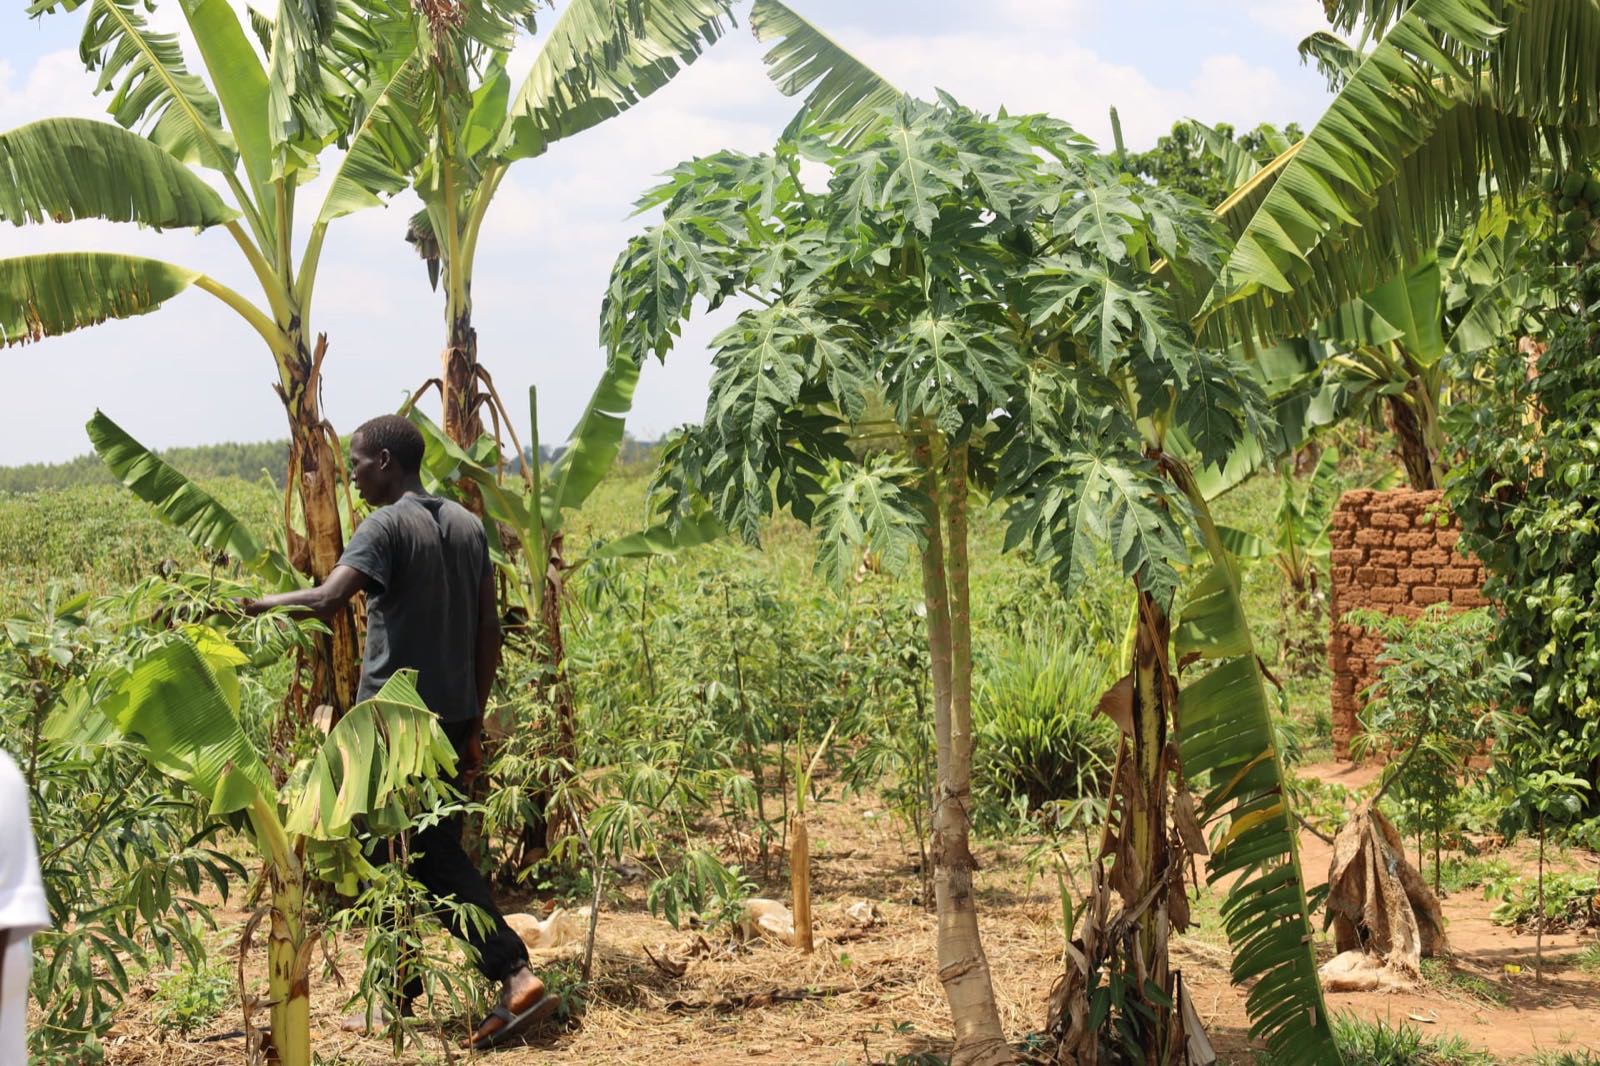
Our four certifications




Our one carbon measurement methodology
Every tree is made of carbon. Because we measure carbon based on the tree's own species biology, the same methodology applies across every Tree-Nation project. All four certifications and every legacy project run on the same carbon math. What varies is the impact goal, land ownership and verification approach, not the calculation. All projects not yet certified are listed as Tree-Nation legacy projects.

Ex-ante CO2 capture is calculated per tree from species biology and climate region. Failure insurance is baked into the final CO2 through survival rate, cull-back, and prudence reductions, and by capping the crediting period at 10 years, keeping every claim defensible even when outcomes vary from projections.
- Per tree, not per hectare
- 10-year crediting cap
- 500 kg per-tree cap
- Integrated failure insurance
A vertically integrated platform for environmental impact
To fight climate change through tree-planting as efficiently as possible, we integrate all operations under one roof, from Project Design Document (PDD) co-design to satellite monitoring, in a cycle of continuous learning and improvement.
Methodology design
We design our own methodologies for carbon and environmental impact based on our ongoing project experience.
Independent academic review
We hire independent academic experts to provide third-party validation and feedback on how we can improve our methodologies.
Site selection
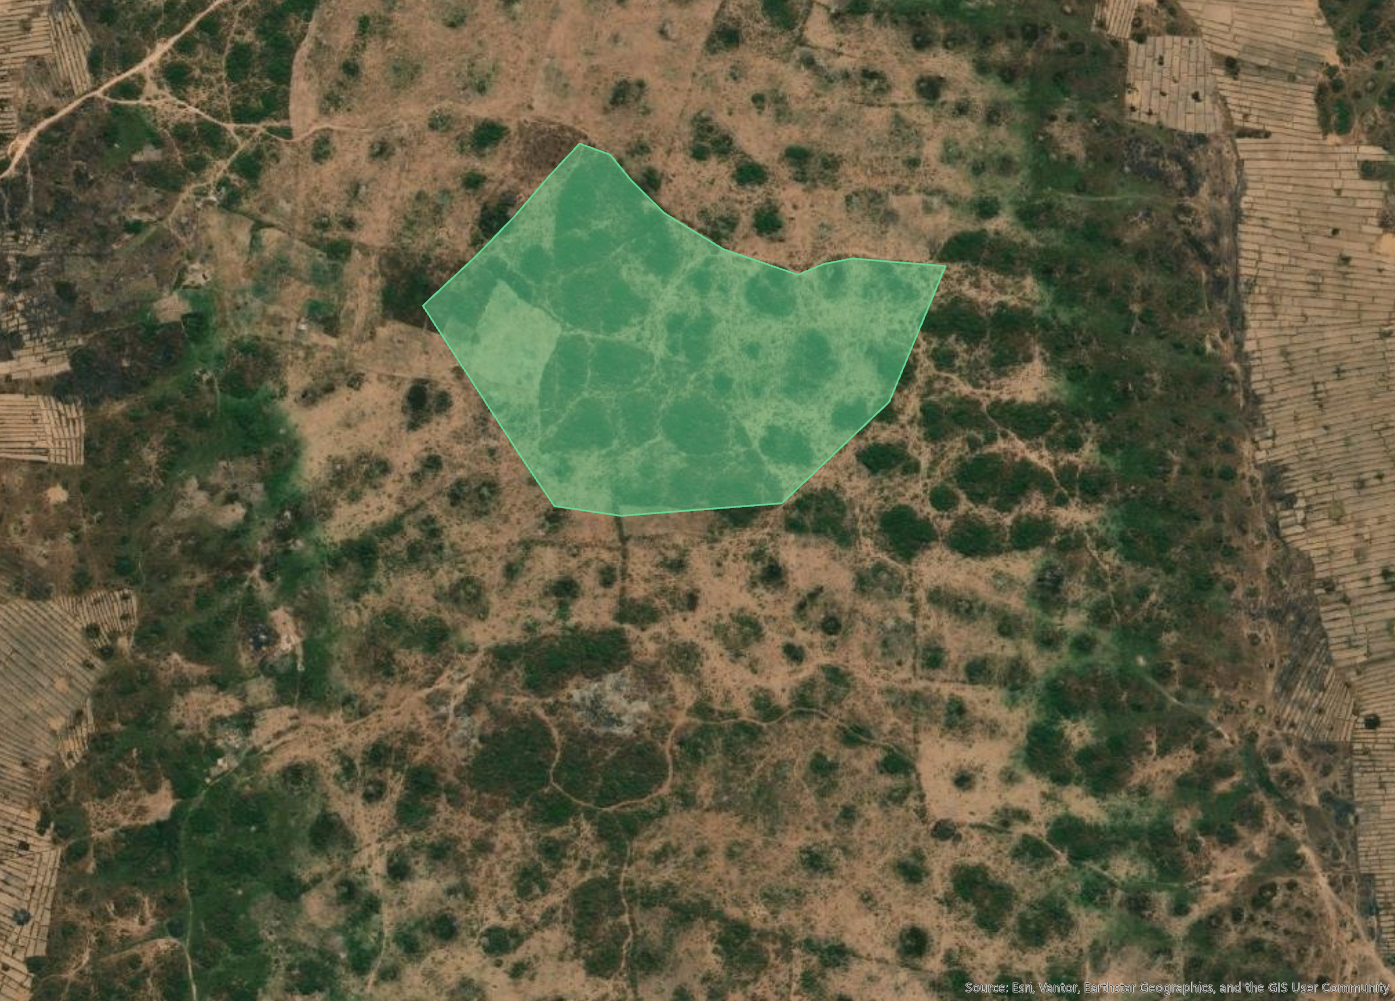
Planting sites are mapped, polygon by polygon, and published publicly on the Tree-Nation platform.
PDD design
Project Design Documents are co-designed with planting partners.
Planting
Trees are planted by our planting partners according to the Project Design Document.
Continuous monitoring
Projects are monitored continuously after planting is completed with annual Verification Quality Score (VQS) reports published.
Methodology design
We design our own methodologies for carbon and environmental impact based on our ongoing project experience.
Independent academic review
We hire independent academic experts to provide third-party validation and feedback on how we can improve our methodologies.
Site selection
Planting sites are mapped, polygon by polygon, and published publicly on the Tree-Nation platform.
PDD design
Project Design Documents are co-designed with planting partners.
Planting
Trees are planted by our planting partners according to the Project Design Document.
Continuous monitoring
Projects are monitored continuously after planting is completed with annual Verification Quality Score (VQS) reports published.
A transparent platform made to monitor our trees together
Tree-planting is hard, and failures happen. That's why our methodology is built with redundancy, and why the data we verify is public. You can check every project for yourself.
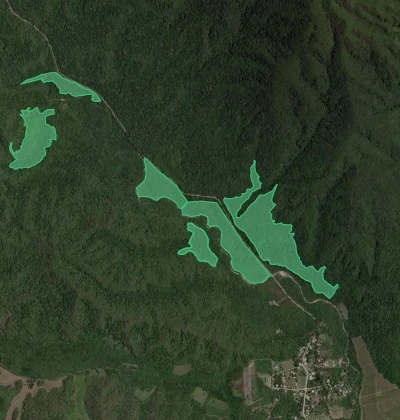
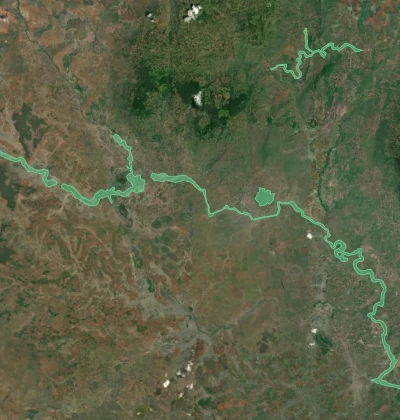
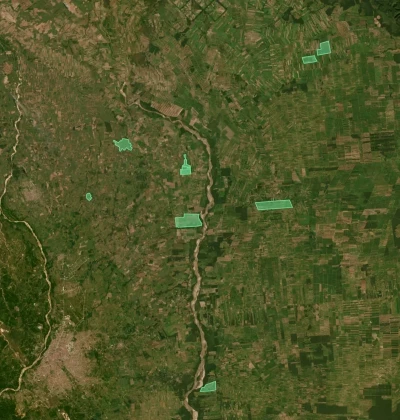
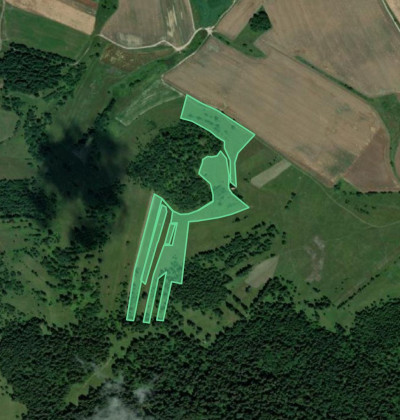
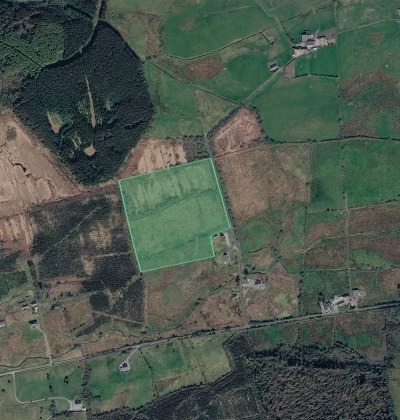
Public polygons
Every planting site boundary is mapped, published, and visible on the map. Anyone can see exactly where the trees go, down to the parcel.
Planting records
Every site's planting is documented twice: what species and quantities were scheduled, and what was actually planted with dates.
- Gmelina arborea — 4,177
- Tectona grandis — 2,859
- Casuarina equisetifolia — 1,434
- Gmelina arborea — 4,177
- Tectona grandis — 2,859
- Casuarina equisetifolia — 1,434
+ 4 more species
- Annona squamosa — 350
- Tamarindus indica — 350
- Annona squamosa — 350
- Tamarindus indica — 350
- Normanbya normanbyi — 3
- Flindersia bourjotiana — 3
- Ganophyllum falcatum — 5
- Normanbya normanbyi — 3
- Flindersia bourjotiana — 3
- Ganophyllum falcatum — 5
+ 59 more species
Geolocated photos
Time-stamped, GPS-pinned photos are captured at planting and updated in every annual monitoring report. They provide a remote view of the planted trees and prove they are growing.
- Project
- Bosques Yungas
- Site
- Enrichment Area Lot 5
- Trees planted
- 974
- Year planted
- 2017
- Type of trees
- Low and upper stratum trees
- Geotagged photos on this site
- 290
Satellite data
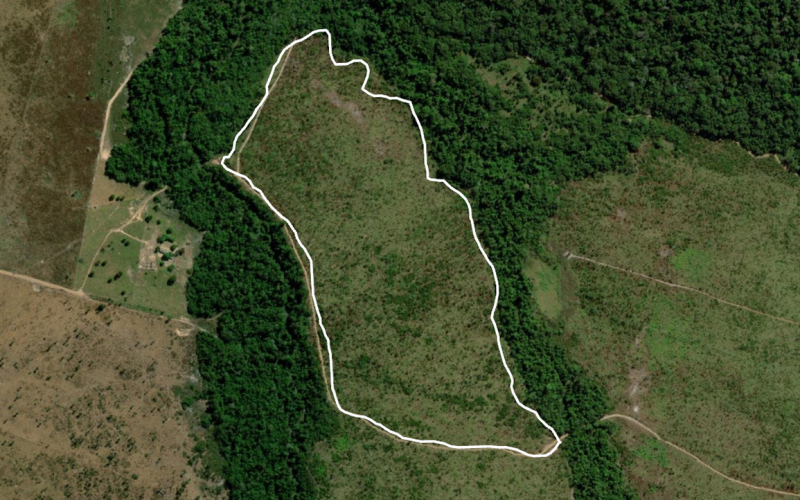
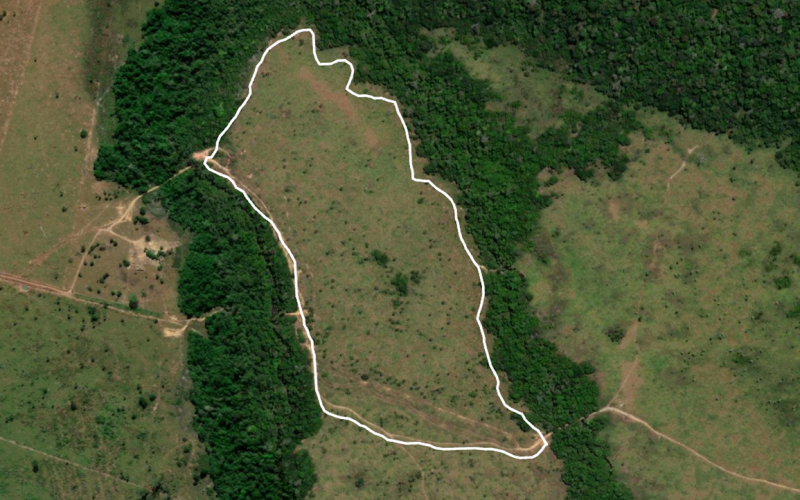
Independent satellite imagery is collected before planting and updated in every annual monitoring report. It tracks canopy growth, biodiversity signals via Enhanced Vegetation Index (EVI), and carbon stored in biomass via Aboveground Carbon (AGC).
Imagery
High-resolution satellite imagery shows canopy development over time, confirming trees are growing where they were planted.
Enhanced Vegetation Index (EVI)
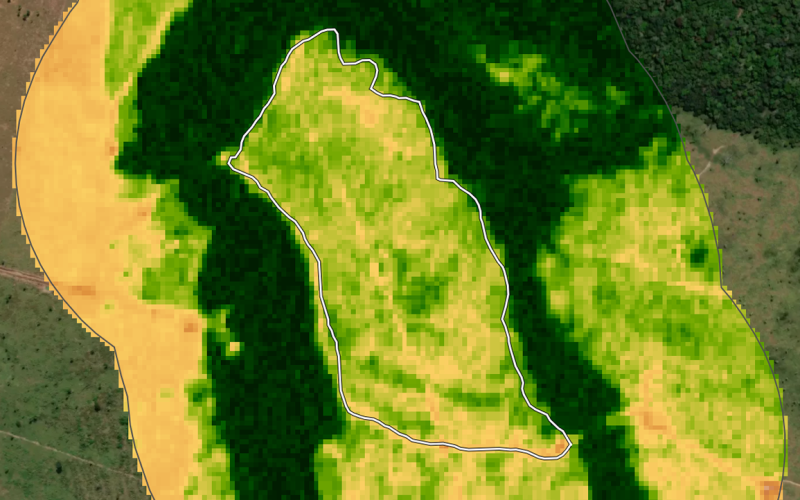
EVI captures photosynthetic activity from satellites, showing how vigorously the vegetation is growing year over year after planting.
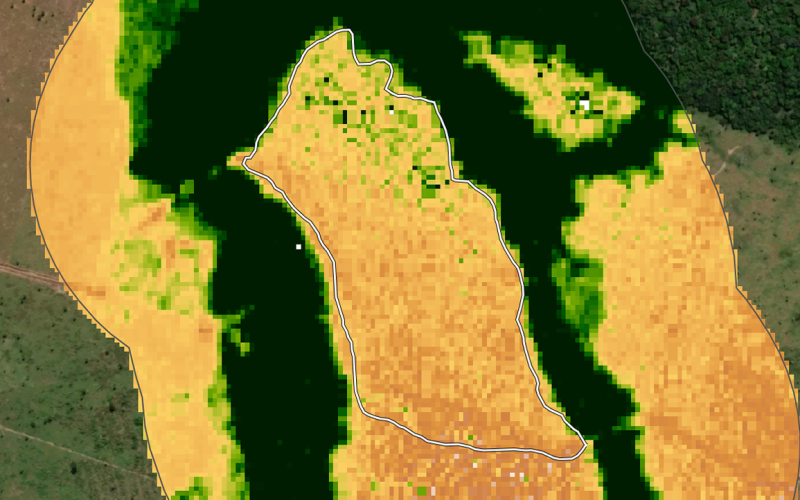
What the colors mean
Trend
+32%
EVI vs. 2020 pre-planting baseline
EVI over time
In plain terms
EVI values dipped sharply right before planting began in 2021, the result of illegal deforestation on the site, falling from a strong 2020 into some of the lowest readings on record in early 2021. Since planting, values have averaged about 32% higher than in 2020, before the clearing took place. The highs and lows you still see each year reflect the Amazon's natural seasonality between drier and wetter periods, not instability, and even the dry-season lows have crept up since planting, a sign the canopy is holding on to more greenery through the driest months.
Based on Sentinel-2 satellite imagery
Imagery
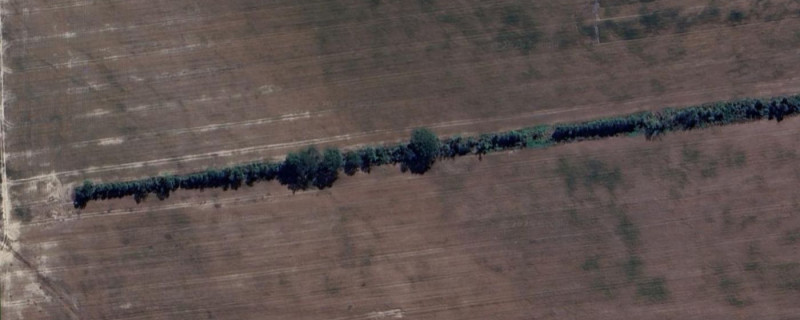
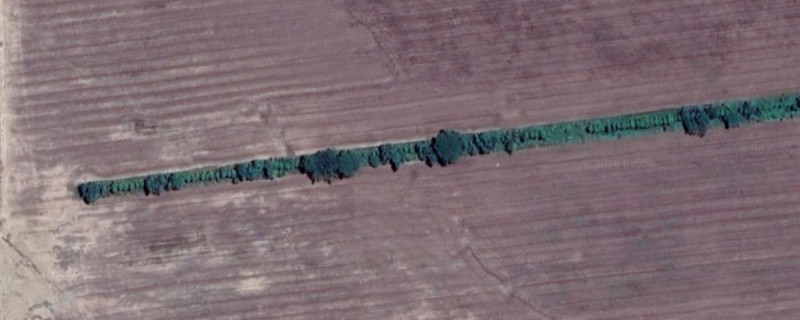
High-resolution satellite imagery of the Amazon Windshield planting line, showing visible canopy growth between 2021 and 2025.
Aboveground Carbon (AGC)
Aboveground Carbon (AGC) satellite data of the same planting line, quantifying how much carbon the growing trees are storing.
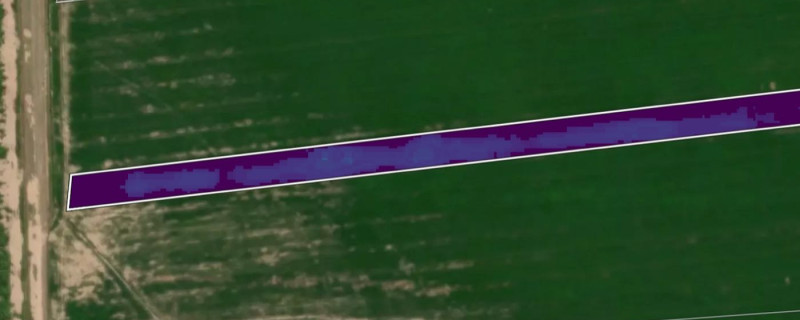
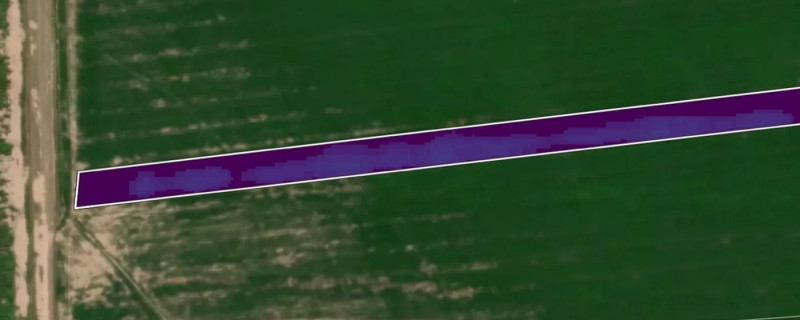
Data from Planet Forest Carbon Monitoring, a new satellite-based product launched in September 2024 that measures aboveground carbon anywhere on Earth from space. Part of how we monitor Foundation projects, and part of where independent, low-cost carbon measurement is heading.
See how we use itOn-site verification
Our field team verifies results on-site, complementing our remote verification system.
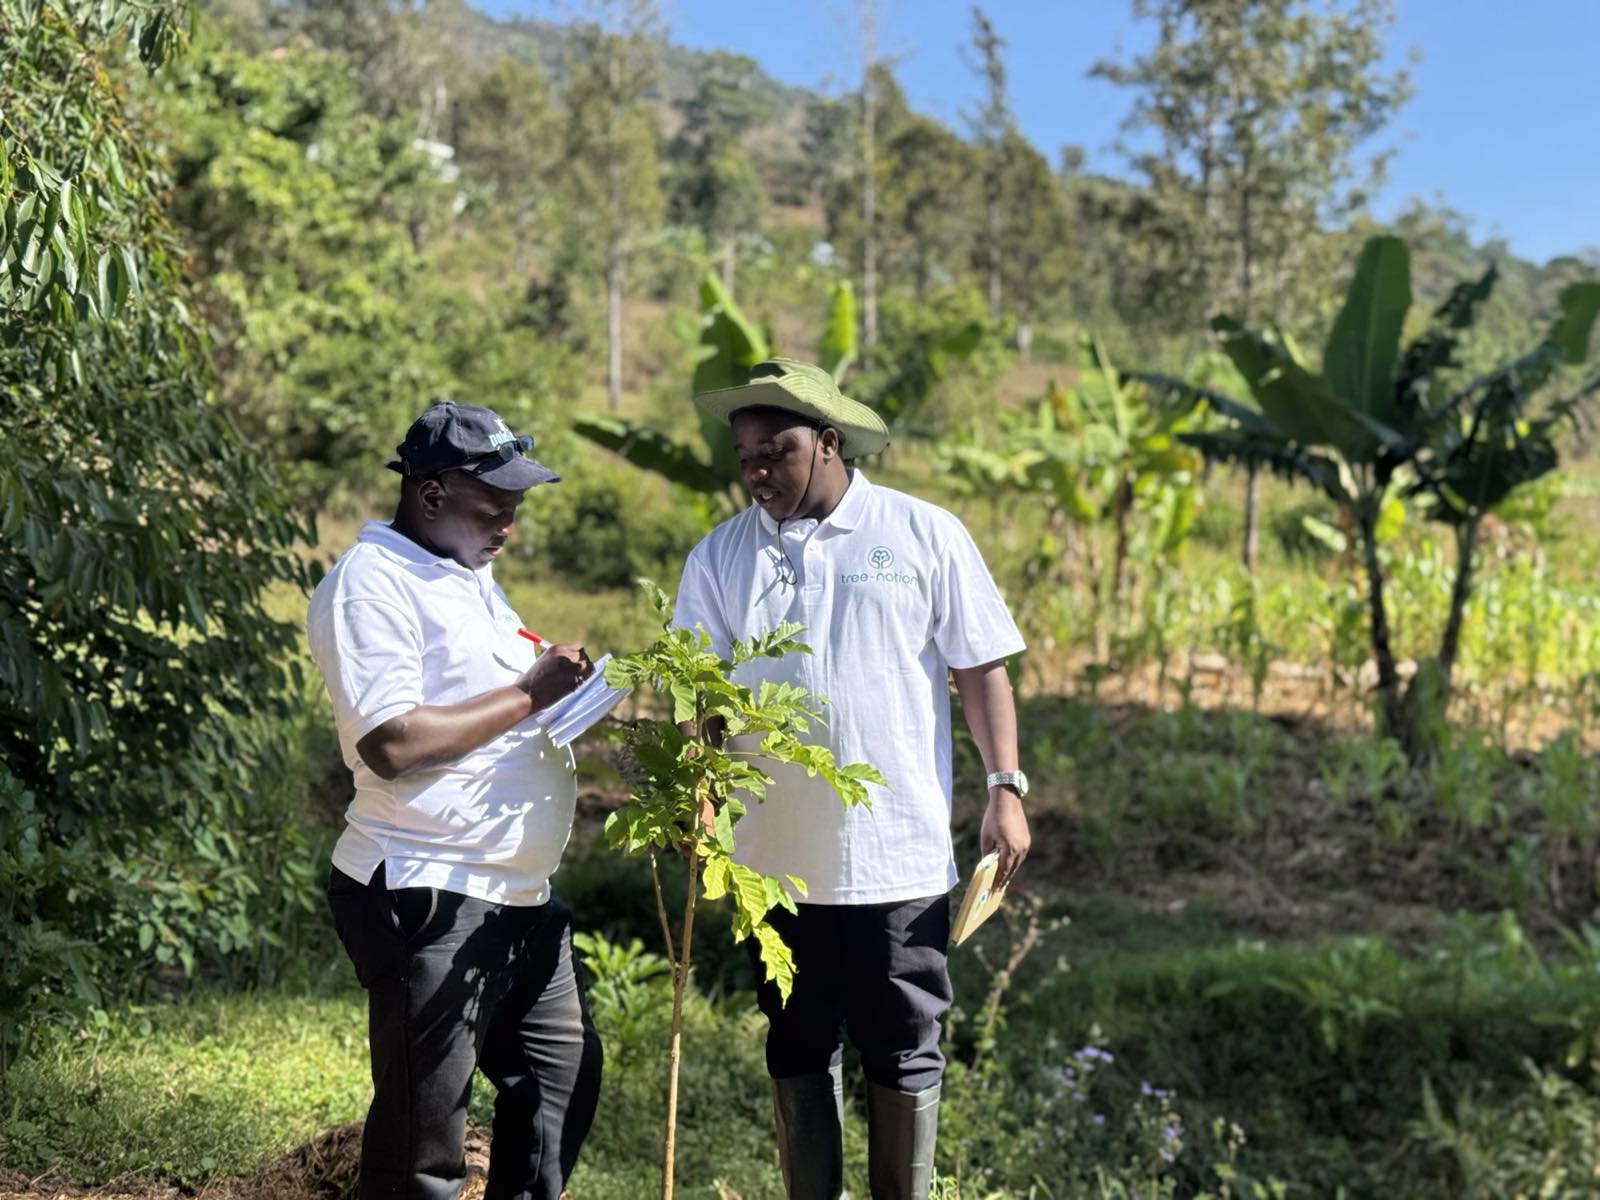
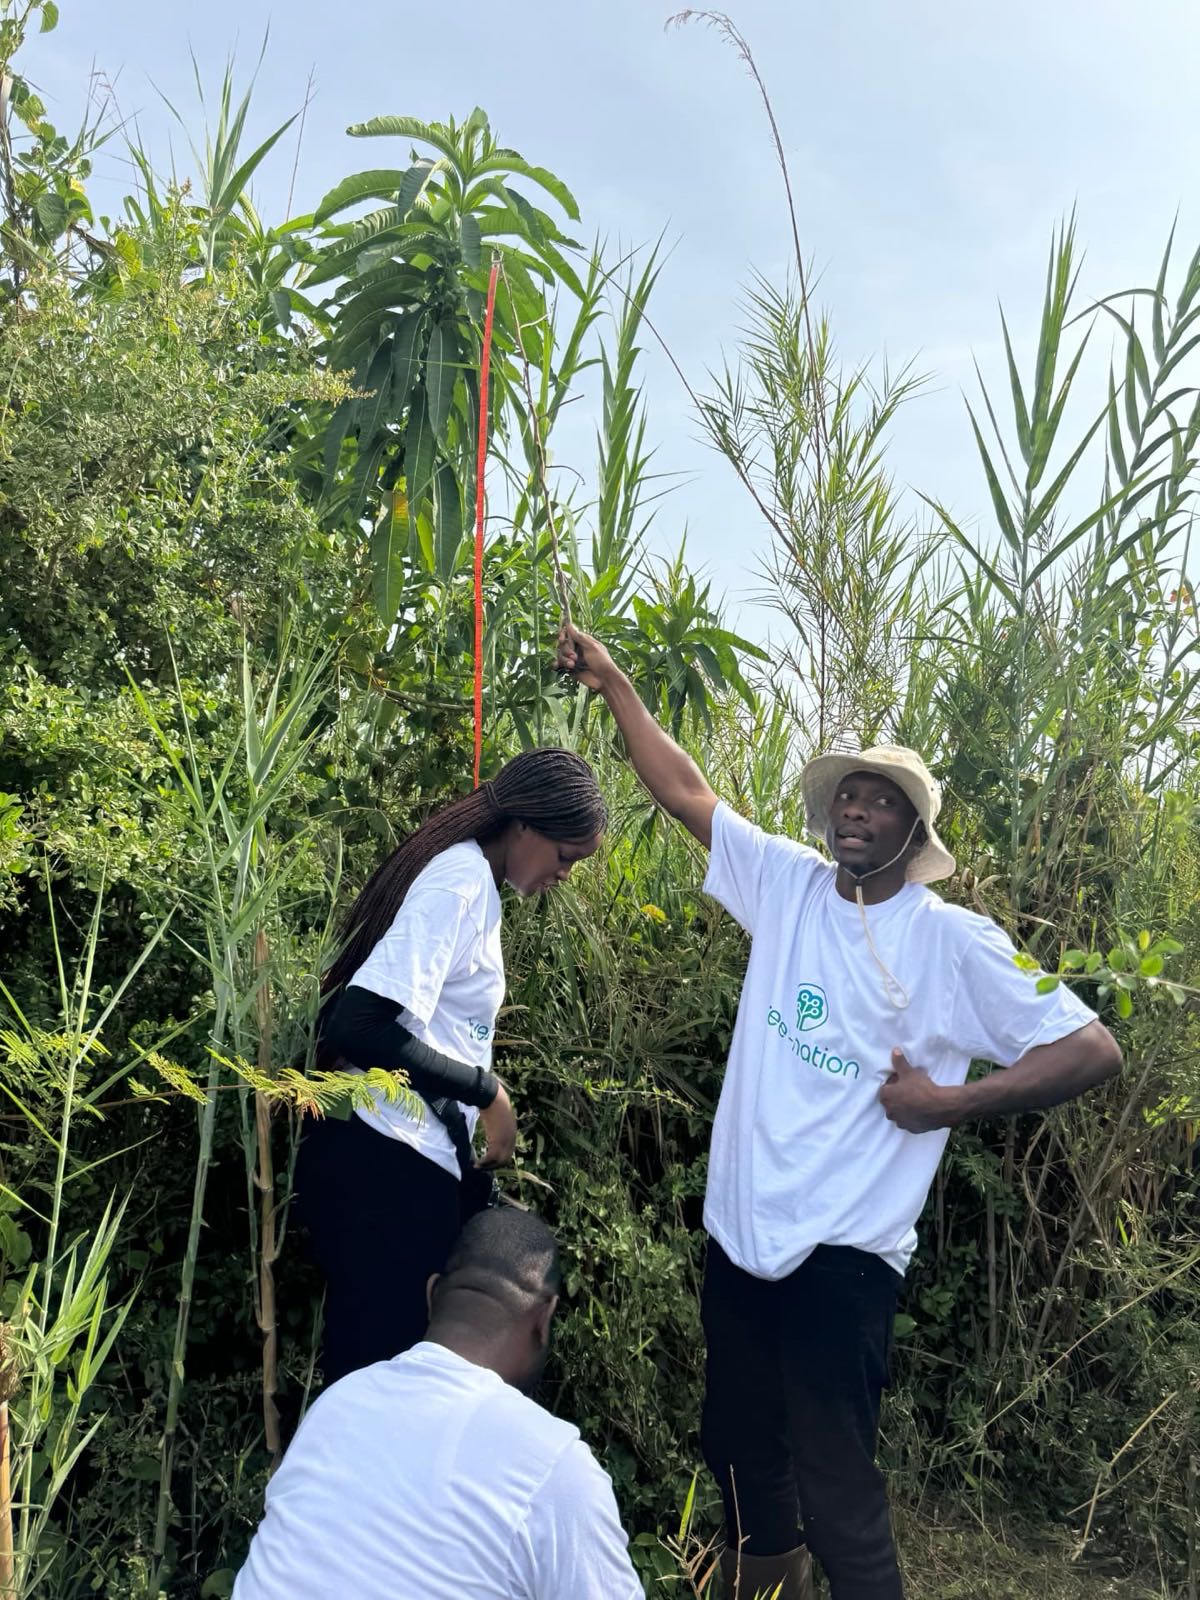
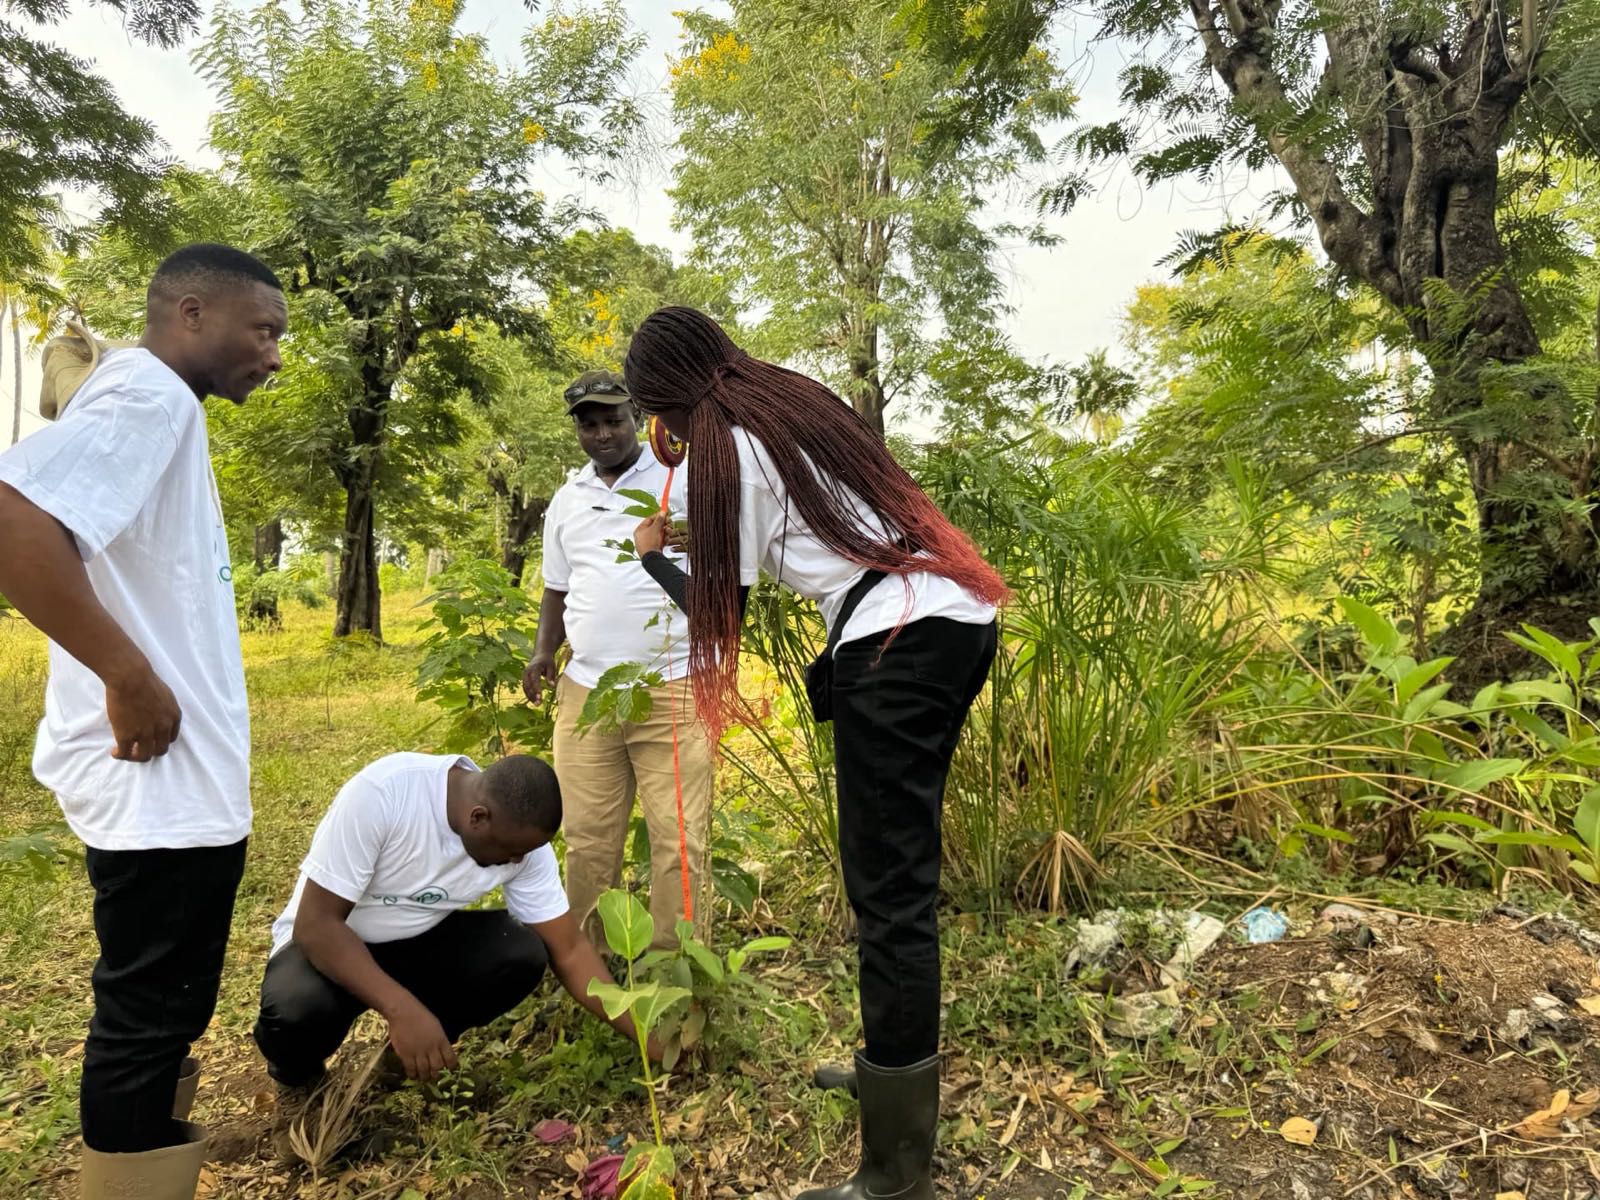
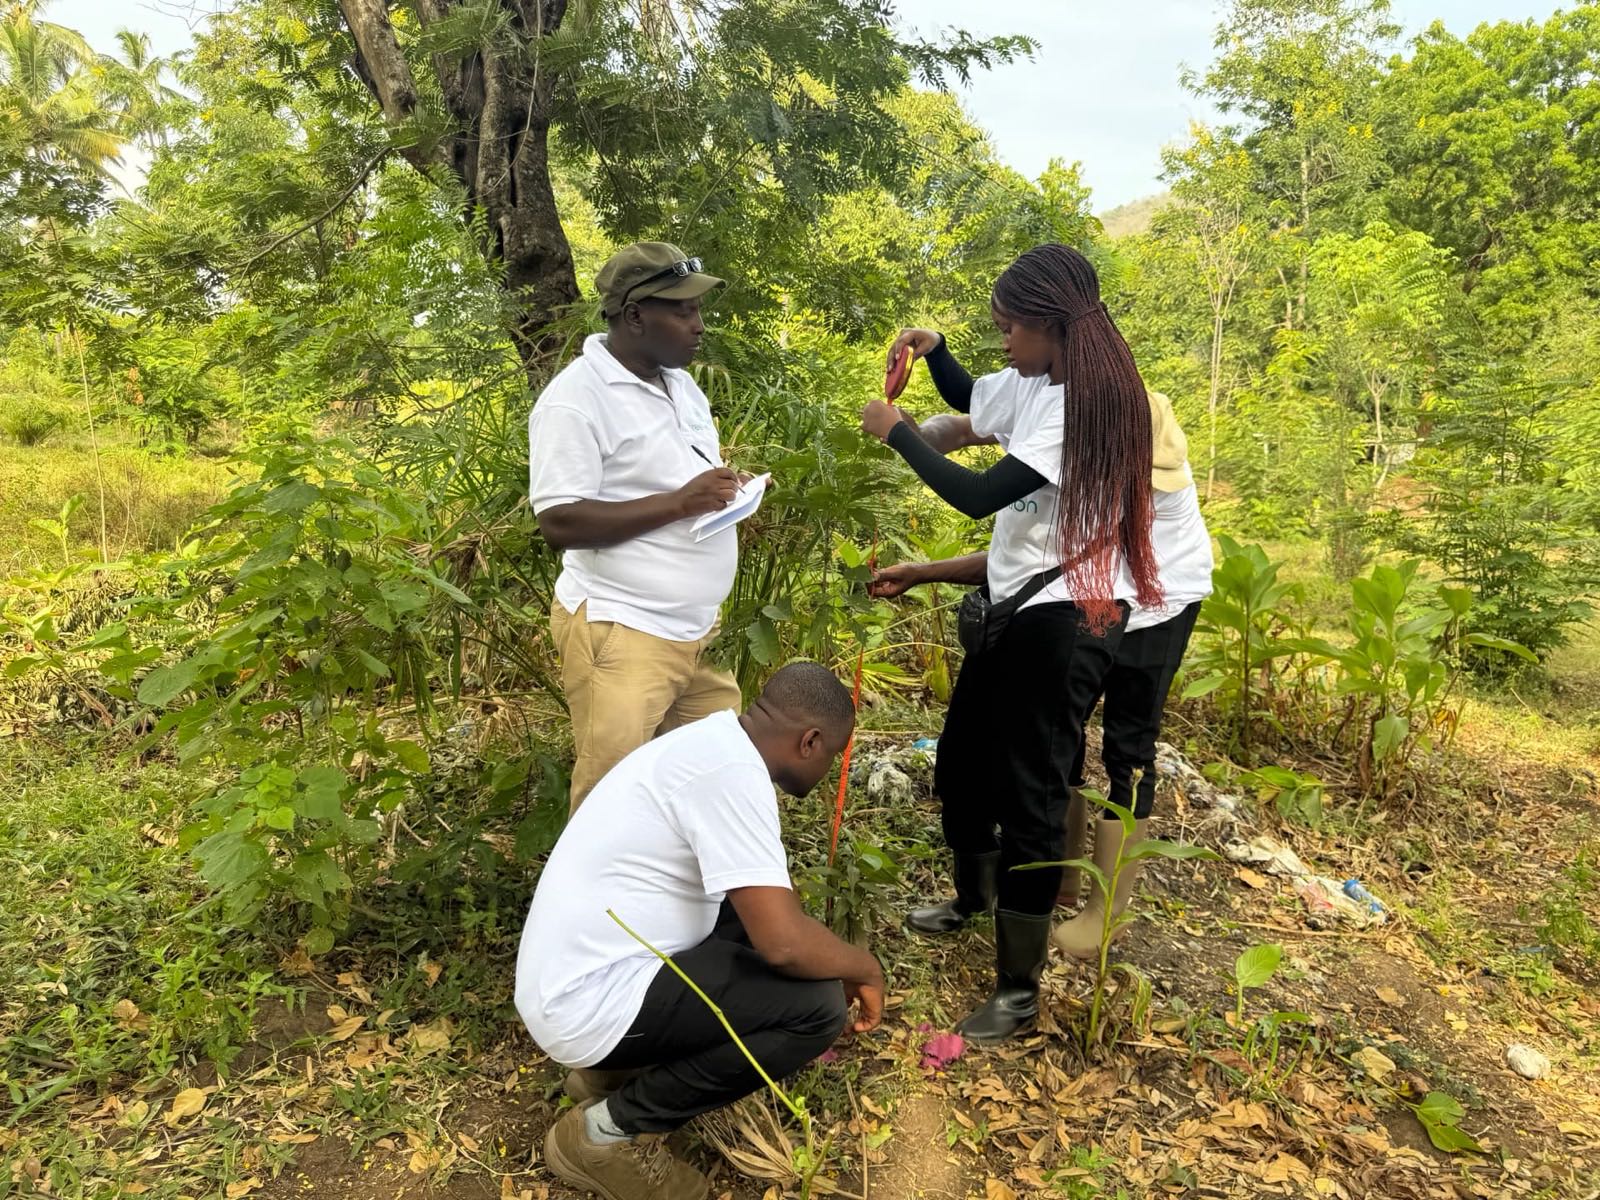
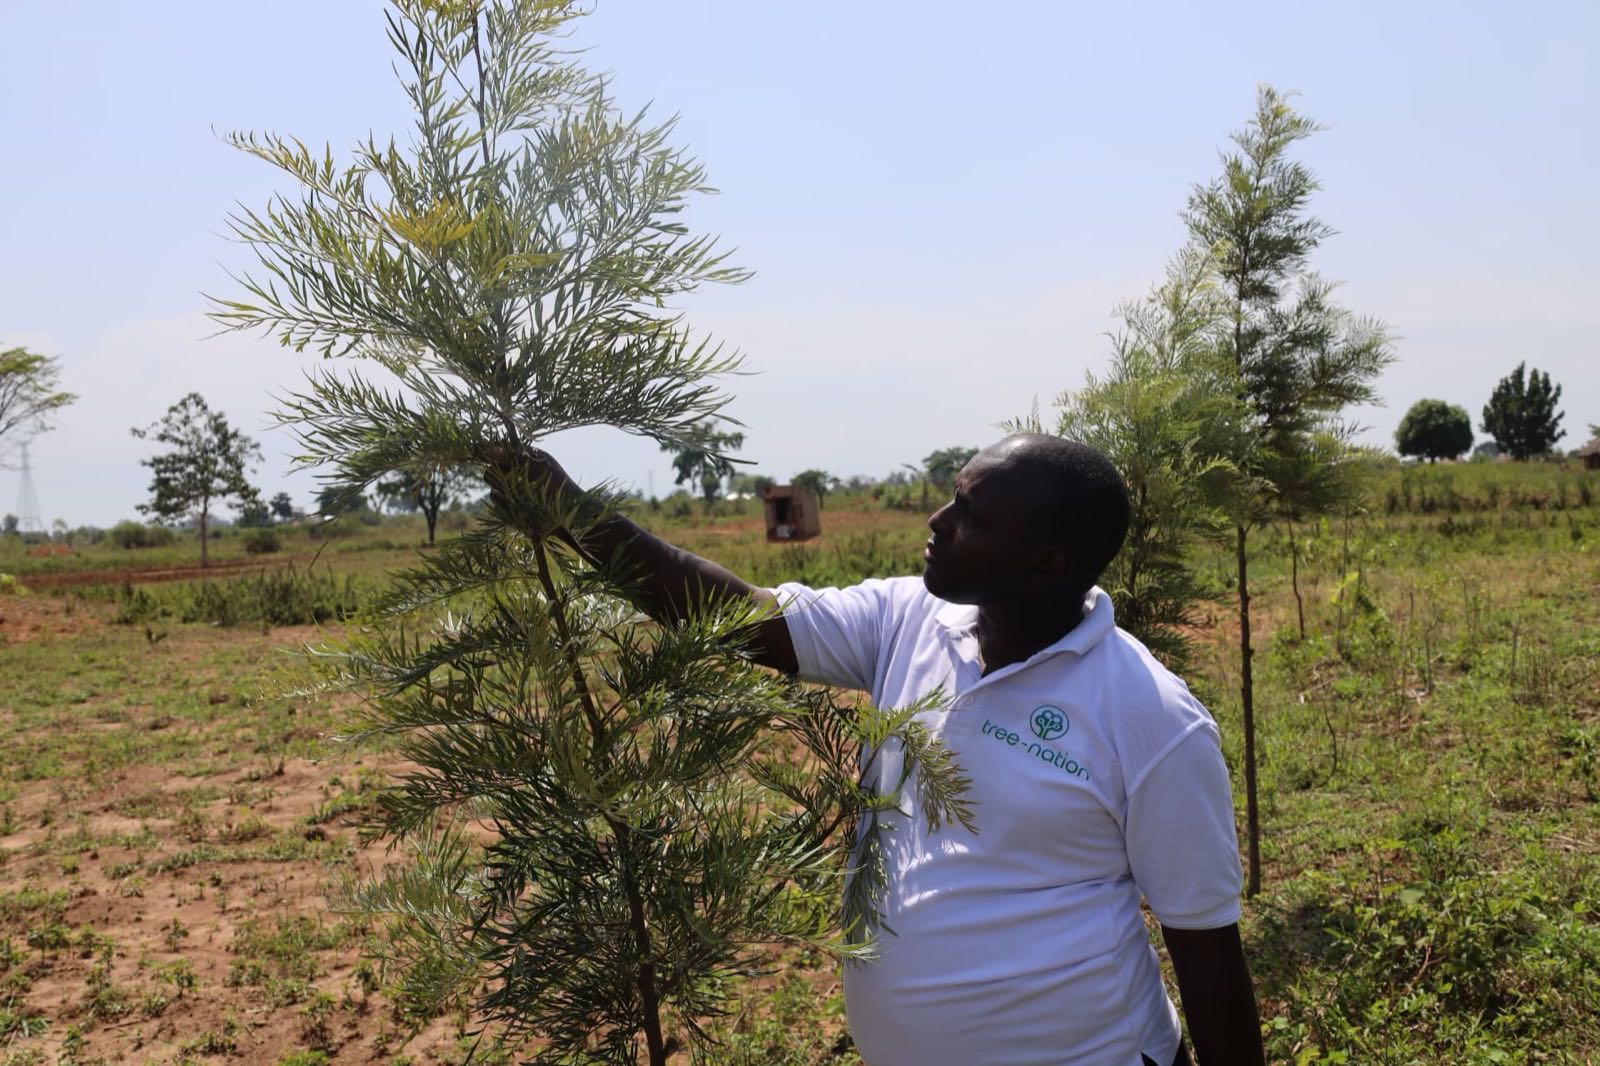
 On-site verification key results
- Survival rate
- 83%
- Tree height
- 40 cm
- Forest health
- Good
- Age of trees
- 1-2 years
- Survival rateSampled counts along planting lines, extrapolated to the full site.
- Species plantedSpecies mix checked against the PDD and the planting report.
- Farmers benefitedParticipating farmers and households confirmed, where applicable.
- Area plantedPlanted area measured on the ground against the public polygon.
- Forest healthCanopy condition, pests, grazing and fire risk assessed visually.
- Tree heightSample measurements taken against expected growth curves.
Verification Quality Score (VQS)
Because tree-planting unfolds over decades, every project is assessed annually through the Verification Quality Score (VQS), a standardised framework tracking how each project progresses year after year. Polygons, planting records, field verification, remote sensing data, and socioeconomic factors are cross-checked into a single annual score, comparable over time and against every other project we fund.
One score per project, per year, produced by cross-checking every evidence layer along the pipeline into a single annual report.
How the score compares by region, 2025
Scores move year to year. Over time, they generally hold steady or rise as trees establish. A drop signals that something may not have gone as expected and prompts closer review of the affected sites.
Following international quality standards
Our methodology is built to fit inside the frameworks your sustainability team already uses. These are the specific ways each standard applies to Tree-Nation projects.
GHG Protocol LULUCF Guidance WRI, 2006
- Six accounting principles (Chapter 2)Relevance, completeness, consistency, transparency, accuracy, and conservativeness applied throughout.
- Reversibility management (Chapter 11)Front-loaded prudency reductions, planter contracts requiring remediation, and force majeure for tail risk.
- Reporting (Chapter 12)Each project publishes a Project Design Document (PDD), Planting Report, and Monitoring Reports with polygons and species records for independent review.
- Ex-ante with monitoring (Section 12.7)Per-tree carbon calculated forward with prudency, capped by species biology, and monitored continuously via satellite and geolocated photos.
SBTi Corporate Net-Zero Standard + BVCM Report SBTi, 2024 & 2026
- Climate contribution alongside your targets (Chapter 6, V2.0)Fits the Ongoing Emissions Responsibility framework, running parallel to your validated near-term and net-zero targets.
- Ex-ante mitigation funding eligible (Criterion C41.3, V2.0)V2.0 explicitly recognizes ex-ante mitigation funding as an eligible climate action, aligning directly with Tree-Nation's forward-looking per-tree methodology.
- Meets integrity criteria (Criterion C42.3, V2.0)Documented baseline, impact pathway, monitoring plan, and transparency delivered through Tree-Nation's Project Design Document (PDD), Planting Reports, and Monitoring Reports.
- Independent third-party assurance at year 5 (Criterion C42.3.d, V2.0)Each certified project receives independent third-party assurance at year 5 of certification, confirming actual delivery and effectiveness once monitoring data is substantial enough to audit meaningfully.
- Meets BVCM design principles (Above and Beyond, 2024)Scale, financing need, and co-benefits delivered across Tree-Nation's certifications in underfinanced geographies.
- Separated from your inventory (Section 6.4, V2.0)Reported in parallel with your Scope 1/2/3, never netted from it, never counted toward target progress.
Certification comparison
Tree-planting across the planet is too diverse for one certification to cover, so we structured our work into four tiers. All four can be used for biodiversity, community, and forest restoration reporting. Climate mitigation reporting applies to Foundation, Mission, and Forest Gardens; Nature is designed with carbon rights reserved for communities and governments, placing it outside corporate climate mitigation disclosures.
| Feature | Foundation | Mission | Nature | Forest Gardens |
|---|---|---|---|---|
| Section 1 — What you receive | ||||
| Carbon offset rights | ||||
| Carbon offset efficiency | ||||
| Socioeconomic impact | ||||
| Biodiversity impact | ||||
| Section 2 — How we verify it | ||||
| Project Design Document (PDD) | ||||
| Public planting polygons | ||||
| Public farmer coordinates | ||||
| Public planting record | ||||
| Satellite carbon measurement | ||||
| Satellite biodiversity measurement | ||||
| Geolocated photos | ||||
| Section 3 — How you can report it | ||||
| CDP Climate Change (Full Corporate) | ||||
| CDP Forests (Full Corporate) | ||||
| CSRD ESRS E1: Climate | ||||
| CSRD ESRS E4: Biodiversity and ecosystems | ||||
| CSRD ESRS S3: Affected communities | ||||
| VSME (SMEs) | ||||
Stars indicate relative strength within each characteristic; a single checkmark indicates the feature is present. A cross indicates the feature is not included.